-
Program
Administrator
ToolkitA Guide to Implementing and Managing Community-Based Adult ESOL Classes and Programs
-
You are here
Chapter 18: Data Management
Behind the Scenes - Chapter 18
Data Management
♦ PRACTICE EXAMPLES
 IMPACT Silver Spring
Sara Mussie, Senior Network Builder
English Language Classes
FIRST OFFERED ESOL INSTRUCTION: 2011
IMPACT Silver Spring offers English classes within its framework of building networks and relationships within the community.
2017-18 DATA
CLASS SITES: 3 CLASS LEVELS: 3
TOTAL ENROLLMENT: 108 unique/156 duplicated
“On registration day, we ask for information that is needed for MCAEL requirements (date of birth, gender, country of origin, zip code, purpose for taking the class) and information that is useful for IMPACT on the registration form. We invite as many volunteers as possible to help.During registration, after the learners take the assessment test and the instructors and volunteers determine which level they are, we give them the registration form that is translated into Spanish as well, to fill out all the information.We ask volunteers to assist if necessary. But at the end, I am the one who checks if everything has been filled out and enters it into our data system. Collecting this data has multiple values for IMPACT; it helps us know:
- the location of the people we serve;
- if they have children and how many they have, so we can provide adequate childcare (we even went further and started asking people for their children’s name, age, and grade if they plan to bring them to the class); and
- how many languages are spoken in the class. As we identify volunteers, we ask if they could assist the people who speak the same language.”
♦ NOTES FROM THE FIELD
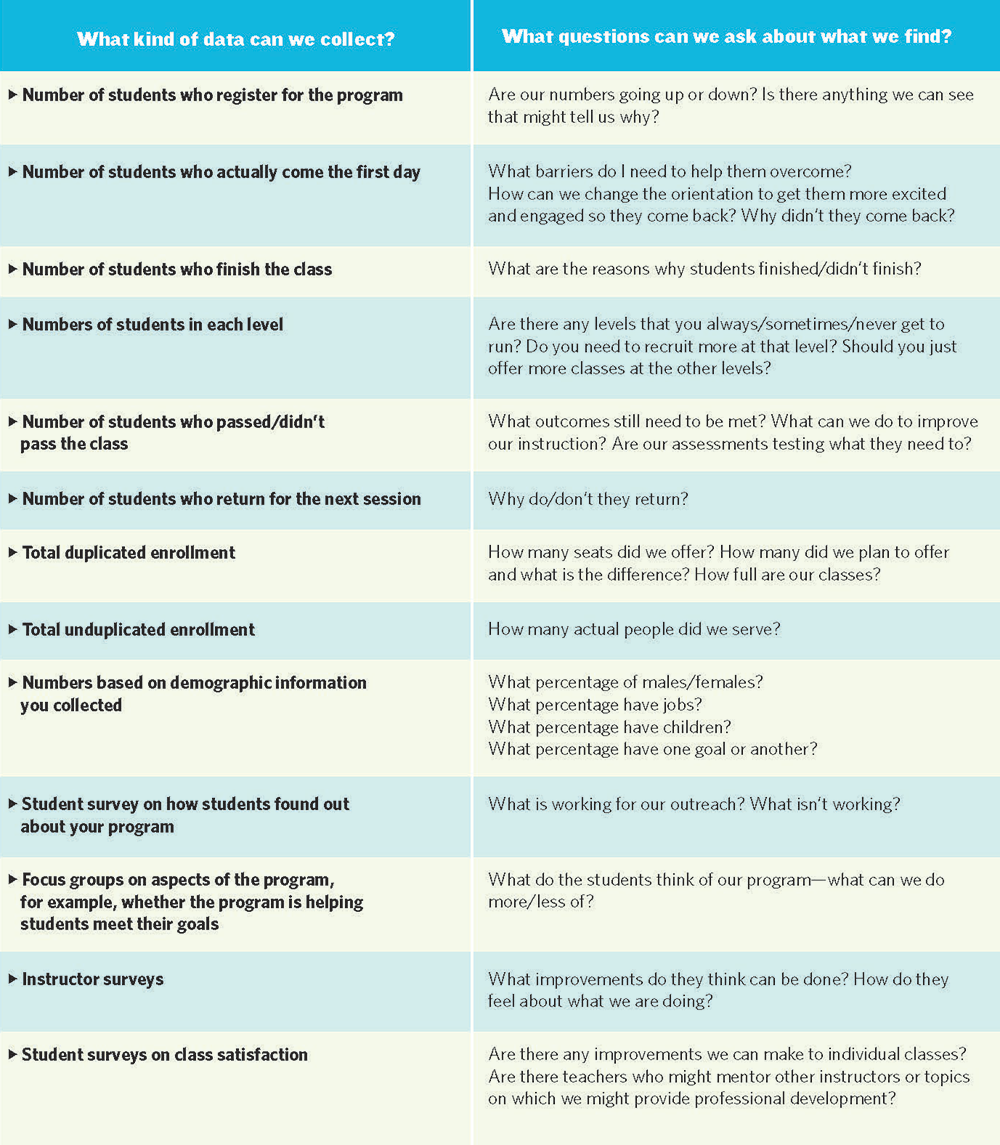
 Debi Edick, former Coordinator, Family English Literacy Program at Linkages to Learning (currently administered by Sheppard Pratt) discusses the information her program collects, how she collects it, and what they do with it.
“On-site staff is responsible for collecting data and submitting it to me (attendance, intake interviews, pre-test scores, learner demographics, posttest scores, and exit interviews).
• Attendance: instructors submit attendance to the Community School Coordinator (CSC), who then enters attendance into our electronic spreadsheet. The spreadsheet is formatted to give me total hours offered, total hours attended, number persisted, etc.
• Intake interviews: The CSC or instructor sits with the learner to find out learner goals. We have six objectives listed and ask the learner which ‘objective’ is something they cannot currently do that they want to be able to do, or progress toward doing, by the end of class: 1) read, write, send email, letter or text in English; 2) communicate basic health information; 3) communicate in English with supervisor, coworkers, customers; 4) communicate with child’s teacher without a translator; 5) practice English with children/grandchildren and 6) write an excuse note for child.
"At the end of the semester, we sit down with the learner to see if they met their goals".
We also ask them for their personal goals, which tend to be “to communicate better” and “to get a job/ better job.” The CSC’s send me the Intake/Exit form (with only the “intake” portion completed) and I enter all responses on a spreadsheet. At the end of the semester, the CSC or instructor sits down with the learner and asks the learner if they met those goals. The CSC then sends me the completed Intake/Exit form and I enter the exit interview responses.
- Pretest scores: I developed a pretest that mirrors the Ventures posttest, so we are comparing apples to apples. Instructors administer a pretest to learners to determine learner strengths/weaknesses.
- Posttest scores: We consider passing to be 75% or better on the Ventures posttest.
- Learner Demographics: Each CSC sends me the Learner Demographic spreadsheet for their site (all data requested on the spreadsheet is on our registration form). I then merge all the individual spreadsheets to a master spreadsheet. In the spring semester, CSCs send me a spreadsheet listing only those learners who are new in the spring. I then add those new learners to the original spreadsheet thus showing us the number of unique learners served.
"I add new learners to the original spreadsheet thus showing us the number of unique learners served."
I use the data to report to our funders, but I also use it to look at attendance and persistence trends from one fiscal year to the next. I am always trying to determine what leads to a class’s success or shortcomings. I look at comparison data based on time class is offered (morning vs. evening), instructors, location, etc. For example, this year I had one instructor who taught two classes; I have observed said instructor many times and find them to be a great teacher. However, both of this instructor’s classes had some of the lowest attendance, persistence, and passing rates in FY18. I will use this information when determining whether to ask the instructor back or not.”


